Solutions Not Symptoms

“But we just redid our comp ratios.”
The manager of mortgage processing at a diversified financial services firm was very frustrated with her Human Resources rep, who she felt was “just not listening.” Fortunately a continuous improvement coach (CIC) who had worked with both managers stepped in. “Let’s field a Rapid Results Team on this, collect some data and work together toward a resolution,” she said and both managers grudgingly agreed.
This firm had been working with continuous improvement for three years and the CIC’s rapid results process had a very good reputation for solving problems quickly. The five person Rapid Results Team included finance people as well as HR and mortgage processors. The team scoped the problem and discovered that the forty-six person department had lost fourteen people in the past eight months, most of them very experienced processors, a 30 percent attrition rate! They too, now understood why this was such a hot issue.
The team read though the exit interviews. It was true that the number one quoted reason for leaving was “better compensation at my new job.” The HR rep on the team confirmed that one processor had just transferred to the credit card group for a 20 percent salary increase, but that person had six years of credit card experience at another bank and had been promoted to a team leader grade level.
In the interviews people described an accelerating pace of work. “We’re used to picking up the slack with the new hires, but this is getting ridiculous. People are cutting their breaks, not taking lunches and I don’t remember that last time I took PTO,” (personal time off, including vacation, sick days and personal days). Statistical analysis confirmed that the department was taking twenty percent less PTO than the rest of the firm.
The team investigated to see if volumes really were heavier and if so, why. Three items became immediately apparent. First, the average processor experience level in the department had dropped from eight years to four years because of the staff turnover.
Second, they learned that there was a housing boom in several of the firm’s markets. A marketing program increased mortgage volume by almost 30 percent over the previous year. The department had hired ten new processors, which with hindsight may have been too few people. This helped satisfy the immediate demand but also put a drain on the experienced processors’ time.
Historically new hires were given three days of training their first week and then trained “as-needed” by more experienced processors for the first year on the job. With the influx of new hires and increased volume, the experienced processors found the part-time on-the-job-training to be more and more difficult.
Finally, management announced the introduction of new mortgage products increasing the complexity of the work and promising even more demands on people’s time. The department was already missing performance targets and now processors new and old were becoming very dispirited.
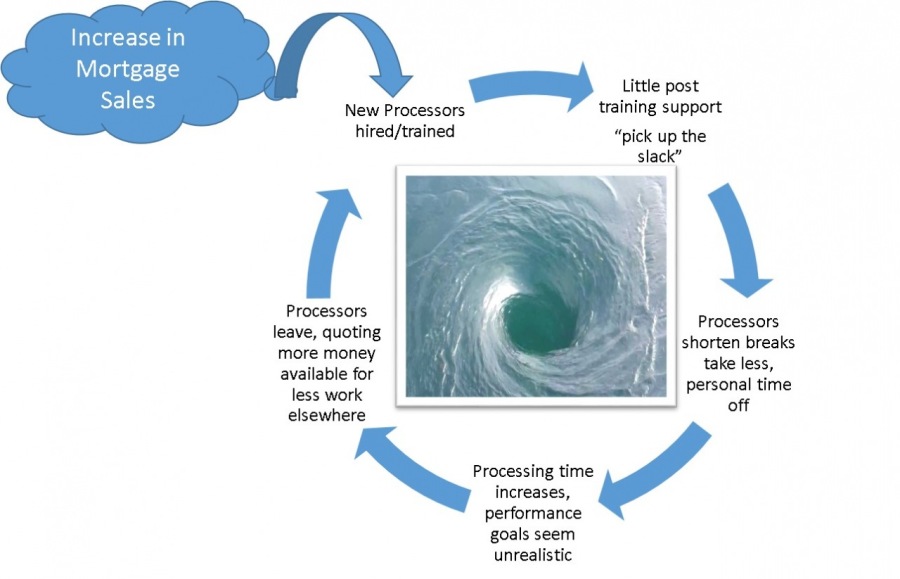
The team quickly formed a view that the escalating workload from increased volume and hiring was contributing more to the problem than misalignment with market salaries. And it would only get worse as more experienced people left. The traditional practice of having experienced processors “pick up the slack and coach the newbies” was fine in a low volume steady state environment, but wouldn’t work with increasing volume and decreasing experience. They created the following illustration to demonstrate the point.

The increase in mortgage sales and numbers of new hires put pressure on the experienced processors to help the trainees. They took the additional workload out of their own time (breaks, PTO, etc.) Processing time went up; goals weren’t met. People started to burn out; then they missed performance bonuses.
Experienced processors started to look for other jobs. It didn’t matter if the other jobs didn’t have as much vacation, or performance bonuses, elements that go into compensation ratios. The processors weren’t getting those benefits anyway. The problem compounded as more people left. The “vicious cycle whirlpool” in the drawing got the attention of the Mortgage Processing Manager and Human Resources.
The solutions were to
1. Change the hiring profile to hire more experienced mortgage processors in the short term to alleviate the workload.
2. Create a formal process for coaching new hires that was accounted for in workflow planning.
3. Adjust the salaries of some experienced processors and make the benefits component of compensation more visible.
With all of the data, the team’s conclusion is very clear; just raising everyone’s pay wouldn’t have worked because compensation was a symptom, not a root cause of the attrition.
Over the last thirty-seven years helping companies improve, I have seen many people try to fix a symptom rather than look for the root cause.
This error often occurs when someone assumes that a single piece of data tells the whole story. In this instance, exiting processors said they were leaving because of inadequate compensation.
It was true that a few people’s salary hadn’t kept pace with what they could earn elsewhere, but their total benefits package was still competitive. The bigger problem was that what they were being asked to do for that money had become unreasonable. They were set up for failure. The presenting symptom was compensation; that wasn’t wrong, but it wasn’t the root cause of the attrition. Understanding that more volume and increased training responsibility was escalating workload suggested the successful solutions.
Assuming that a symptom is a root cause is a common failing of experienced people who remember a time when it was the root cause. “I have seen this before: Our comp ratios are out of whack.” Inexperienced people don’t have that history so they are more likely to go investigate, which is why you should always have some newbies in root cause analysis sessions.
Root cause tools like 5 Whys, fault trees, and process analysis are all small group facilitated processes and therefore very susceptible to the assumptions and biases of those in the room. These tools are useful to identify a range of possible causes. But a cause identified with brainstorming tools like these should always be investigated and examined with data analysis.
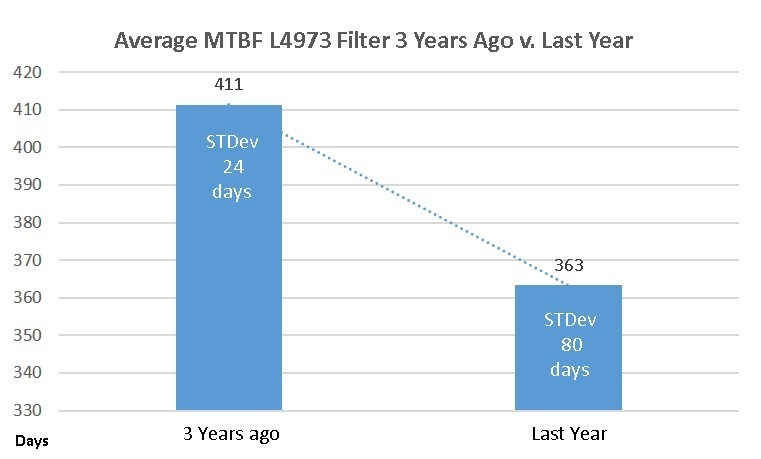
A chief maintenance technician in a chemical plant “hated these big companies shipping their manufacturing overseas.” Then a fluid filter that was used all over his plant started to have performance problems. The supplier had recently moved production to Thailand, and he instantly said “that is the problem. We need to dump this supplier!” He even produced data. The mean time between failures (MTBF) of this filter had declined from an average four hundred and eleven days with a standard deviation of twenty-four days to an average of three hundred sixty-three days with a standard of deviation of eighty days dating from the time of the off-shoring three years ago.

The graph was very damning.
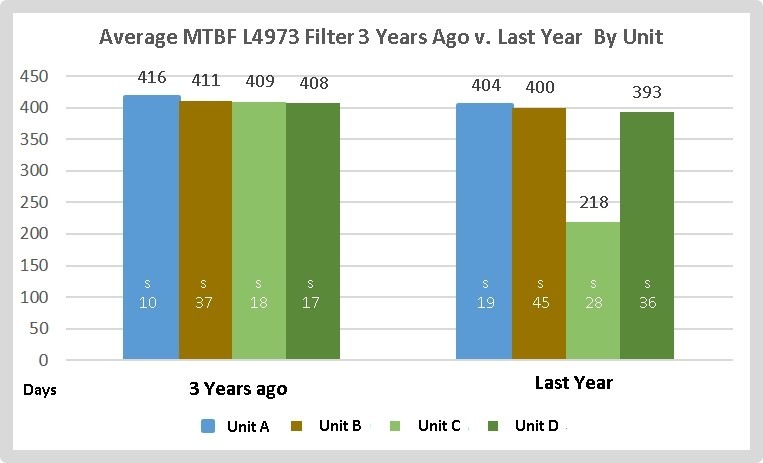
Then an operations technician showed him the same data broken out by section of the plant. What was apparent was that the entire MTBF decline was from one area of the plant. That area had added new input lines and was operating beyond the pressure specs of this particular filter.

You have to dig deep into the data otherwise you may simply “find what you are looking for.”
Once you think you’ve discovered the root cause and have devised a solution that will solve it, then test it. You have to design an experiment and gather new data to test your hypothesis about root cause and another to confirm the solution.
“Solving symptoms” rather than root causes is common in business. It is an understandable downside of how the experienced brain works. However, continuous improvement professionals repeat this simple mantra: Solutions not Symptoms, Solutions not Symptoms. . . .
The process that follows from the mantra is:
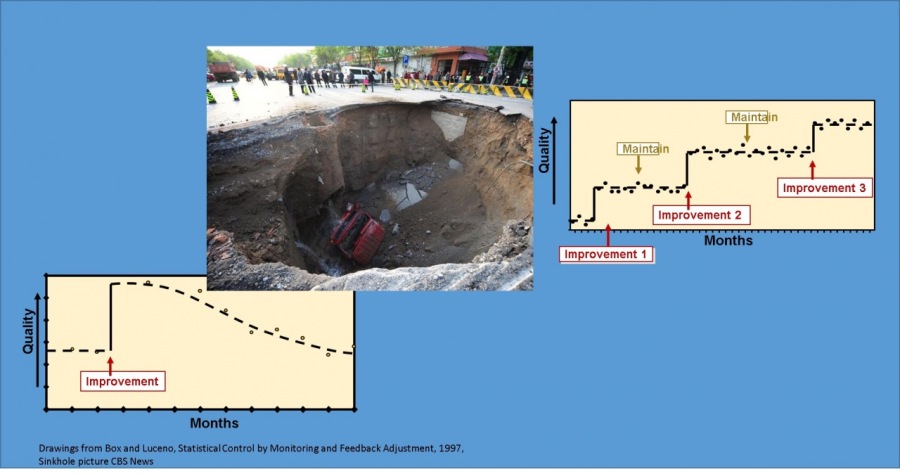
Attempting to “solve a symptom” may be human nature, but solving the root cause ensures that the problem is truly addressed and stays completely solved“But we just redid our comp ratios.”
Identify potential root causes (Hints: slow it down, test your assumptions, Ask “How do you know that?”
Investigate (Hints: gather data – form hypotheses about root cause)
Analyze data (Hints: confirm hypotheses, create solution)
Test solution (Hints: Ask, “Did it eliminate root cause? Did it solve the problem?”)
Copyright Alan Cay Culler 2018 Thanks for reading; I welcome your comments and shares
For 37 years I have been helping leaders make strategic change. If you would like to know more, please contact me at alan@results-alliance.com. +1-973-744-4911
Articles from Alan Culler
View blog
Heath Ledger, Mark Addy, Paul Bethany, Laura Fraser, and Alan Tudyk in the 2001 Columbia Pictures Fi ...

Continuous Improvement (CI) is a discipline that has been around in the United States (at least) sin ...

Image: Construction of the Steve Jobs Theater, Apple "Mothership," new headquarters Cupertino, Calif ...
You may be interested in these jobs
-
Data Analyst
Found in: Dice One Red US C2 - 20 hours ago
KBR Washington, United States Full timeTitle: · Data Analyst - SecretThe Data Analyst supports operations and conducts data analytics projects to provide information and insights to stakeholders for decision-making or solution development; implements data standards and deploys automation tools to extract, synthesize, ...
-

Team Member
Found in: beBee S2 US - 4 weeks ago
Whole Foods Market Novato, United States OTHERAre you a Foodie seeking a new and exciting opportunity? Come join the Whole Foods Market team where you'll work in a professional environment, with the highest quality ingredients and have a true work-life balance We are currently hiring for a variety of roles with various sched ...
-

Delivery Specialist
Found in: MyJobHelper US C2 - 4 days ago
O'Reilly Auto Parts Bradford, United StatesThe Delivery Specialist will maintain and operate store vehicles to deliver parts and/or products to professional customers in a safe and efficient manner. This position will also collect money on C. O. D. deliveries and pick up customer returns. ES Delivery Specialist, Delivery, ...

Comments